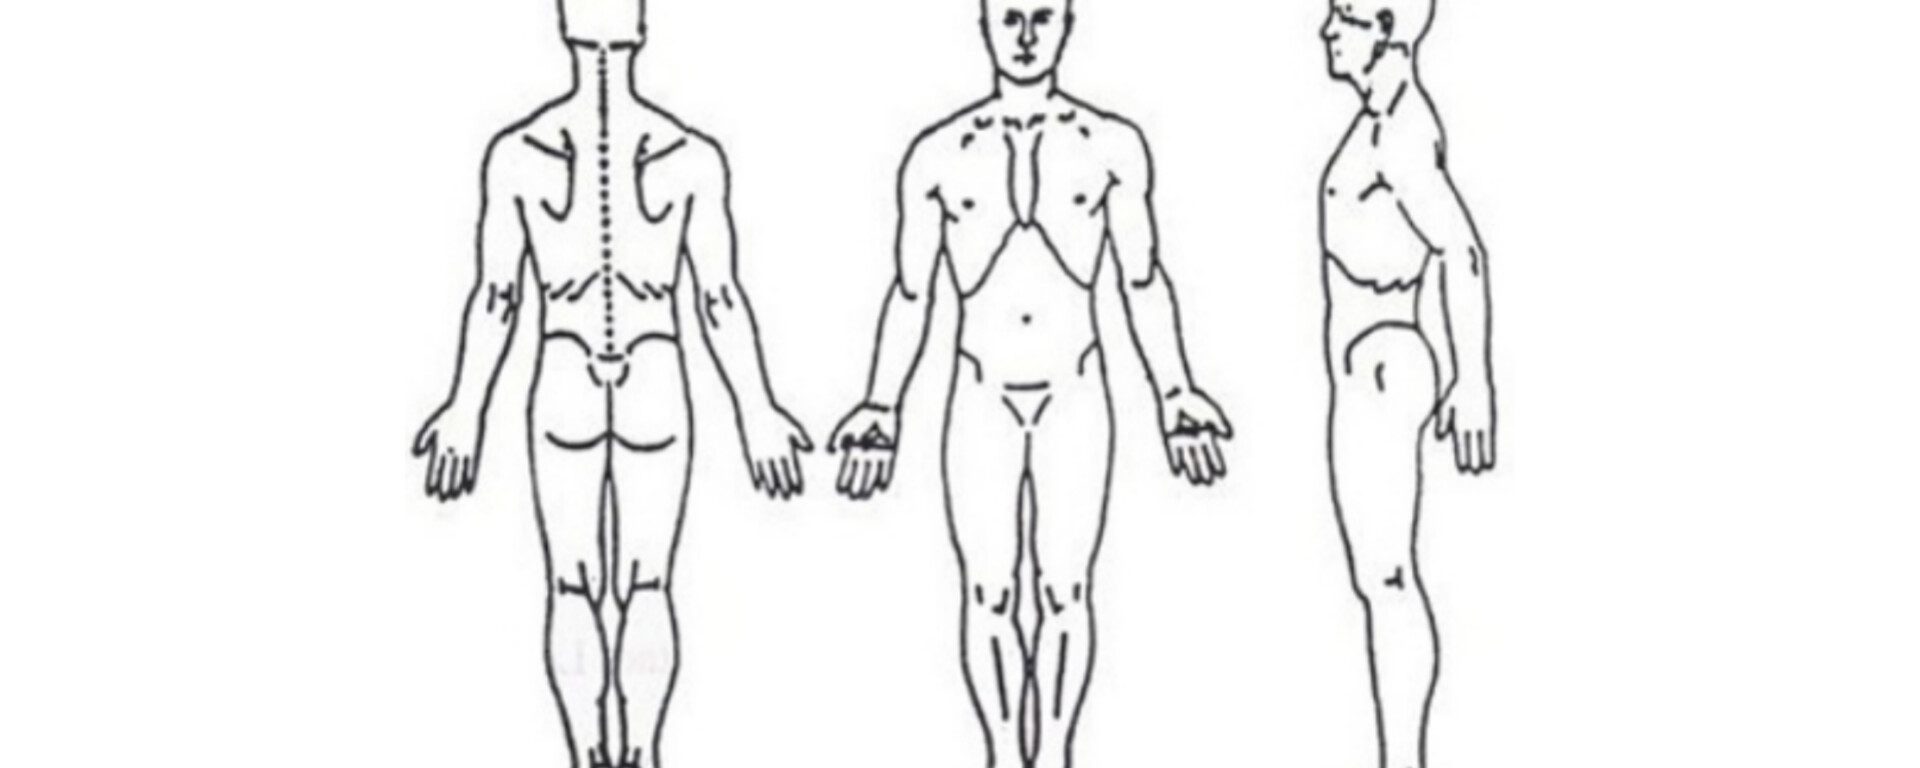
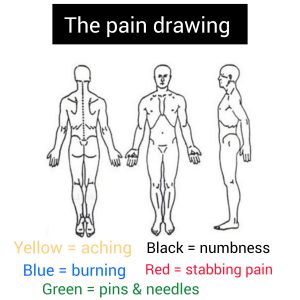
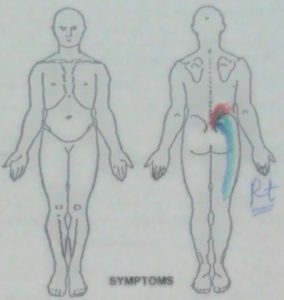
The pain drawing
On a standardised and styled graphic representation, a self-reported multi-coloured graphic representation of the location and distribution of pain and other symptoms Six different colours signify six different sorts of symptoms, as shown below:
- Yellow = aching
- Blue = burning
- Green = pins & needles
- Black = numbness
- Red = stabbing pain
The use of colours rather than symbols had not been approved. Colours, on the other hand, have lately been described in the literature (Hildebrandt J. et al., 1988) and shown to be equal to standard symbol representations. It can also be used as a screening tool for psychosocial distress, as stated by Ransford et al. (1976), who defined four types of improper pain descriptions:
- Unreal illustrations (whole leg pain, circumferential leg pain, and so forth).
- ‘Expansion’ or’magnification’ symptoms include anterior knee pain, iliac crest discomfort, groyne pain, anterior perineum pain, pain outside the figure outline, and so on.
- Explanatory notes, circles around specific portions, and arrows are examples of “I particularly hurt here” signs.
- Pain locations in the trunk, head, neck, and upper extremities are “look how bad I am” signs.
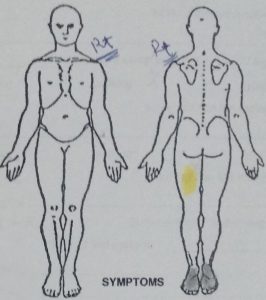
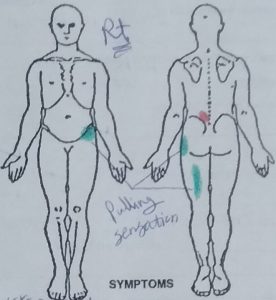
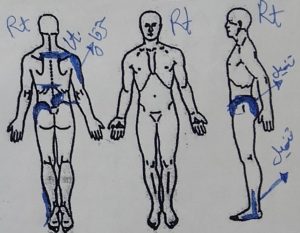

According to Ransford et al. (1976), more than two points led to the conclusion that the pain drawing was abnormal.
Measurement of pain intensity
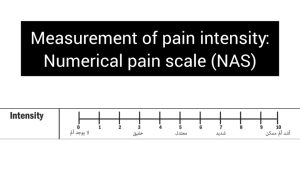 While several techniques can be used to assess pain severity, some appear to be superior to others (Hawker et al., 2011). Two of the most often used measures, the visual analogue scale (VAS) and the NPRS, have demonstrated construct validity and reliability (Hawker et al., 2011). One disadvantage of the VAS is that it requires the subject to physically mark a point on a 100-mm-long continuous line that symbolises their pain intensity and is anchored by two verbal adjectives (usually ‘no discomfort’ and ‘worst possible pain’). Participants must have good visuospatial ability to make this decision, and there is evidence that people with cognitive or motor impairments may struggle with the VAS more than the less sophisticated NPRS (Hawker et al., 2011; Salaffi et al., 2012). The NPRS’s 0–10 numbering system makes it a practical and simple measurement instrument that may be given verbally or graphically (Hawker et al., 2011). Cliborne et al. (2004) employed the NPRS in the only study found in the current search that explored the reliability of pain intensity during the application of physical tests.
It is critical for the follow-up that meaningful changes in pain intensity can be identified. Several writers (Childs et al., 2005; Farrar et al., 2001; Salaffi et al., 2004) have explored the least clinically relevant difference (MCID) for changes in pain intensity when utilising the NPRS. In individuals with subacute low back pain (Childs et al., 2005) and chronic pain associated with osteoarthritis (Salaffi et al., 2004), an MCID of 2 points was demonstrated.
Farrar et al. (2001) found that a 1.74-point reduction from the baseline score was associated with meaningful change (much or very much better) for patients suffering from chronic pain caused by a variety of conditions such as diabetic neuropathy, post-herpetic neuralgia, chronic low back pain, fibromyalgia, and osteoarthritis. Farrar and colleagues also showed that a 2-point (or 30%) drop in pain intensity was associated with substantial change, and that specificity climbed to 92% when the reduction was extended to 3-points (or 50%).
Salaffi et al. (2004) found that an individual’s baseline pain intensity affects the extent of the change required to see an MCID. They discovered that for individuals with baseline pain of 4 or below, a substantial decrease (much better) was 0.7 points (a 17% decrease). However, for patients with baseline pain intensity between 4.1 and 7, a 2.1 point (33%) decrease was required, and for those with baseline pain intensity greater than 7, a 2.8 point (40%) decrease was required.
References
- Childs, J. D., Piva, S. R., & Fritz, J. M. (2005). Responsiveness of the numeric pain rating scale in patients with low back pain. Spine, 30(11), 1331-1334.
- Cliborne, A. V., Wainner, R. S., Rhon, D. I., Judd, C. D., Fee, T. T., Matekel, R. L., & Whitman, J. M. (2004). Clinical hip tests and a functional squat test in patients with knee osteoarthritis: reliability, prevalence of positive test findings, and short-term response to hip mobilization. Journal of Orthopaedic and Sports Physical Therapy, 34(11), 676-685. doi:10.2519/jospt.2004.1432.
- Hawker, G. A., Mian, S., Kendzerska, T., & French, M. (2011). Measures of adult pain. Arthritis Care and Research, 63(SUPPL. 11), S240-S252.doi:10.1002/acr.20543.
- Hildebrandt J, Franz CE, Choroba-Mehnen B et al. The use of pain drawings in screening for psychological involvement in complaints of low-back pain. Spine 1988;13:681-5.
- Salaffi, F., Ciapetti, A., & Carotti, M. (2012). Pain assessment strategies in patients with musculoskeletal conditions. Reumatismo, 64(4), 216-229.
- Salaffi, F., Stancati, A., Silvestri, C. A., Ciapetti, A., & Grassi, W. (2004). Minimal clinically important changes in chronic musculoskeletal pain intensity measured on a numerical rating scale. European Journal of Pain, 8(4), 283-291. doi:10.1016 j.ejpain.2003.09.004.
- Ransford AO, Cairns D, Moore D. The pain drawing as an aid to the psychologic evaluation of patients with low-back pain. Spine 1976;1:127-34.