A diagnostic test is a clinical procedure used to determine the presence, absence, or extent of a disease or condition. These tests are essential for diagnosing illnesses, guiding treatment decisions, and monitoring disease progression. They can involve various methods, such as physical examinations (e.g., manual tests such as valgus test of the knee, apprehension test of the shoulder), imaging (e.g., X-rays, MRIs), or laboratory tests (e.g., blood tests, urine tests).
Since diagnostic tests are fundamental to clinical practice, clinicians must be skilled at selecting the most appropriate test for diagnosing a patient’s condition. In practice, clinicians often opt not to use the expensive “gold standard” tests initially. Instead, they may prefer less expensive, less invasive, or less painful alternatives. For instance, when diagnosing a patient with lumbosacral radiculopathy, a clinician might first use a series of manual tests — such as sensory, motor, neurodynamic, and deep tendon reflex tests — before resorting to a more definitive, but also more expensive, magnetic resonance imaging (MRI) test (1).
Therefore, it is essential for clinicians to be skilled in selecting the most appropriate diagnostic tests for their patients. This article presents the test characteristics and test performance metrics that clinicians look for when selecting diagnostic tests.
1. Diagnostic test characteristics:
1.1 Sensitivity and specificity:
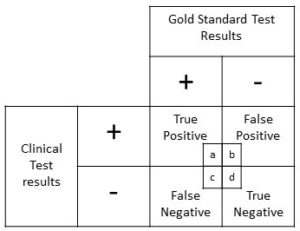
The efficacy of a diagnostic test depend on factors such as its ability to correctly identify those with the disease (sensitivity) and its ability to correctly identify those without the disease (specificity). Therefore, sensitivity measures the true positive rate i.e., the test’s ability to correctly identify those with the disease and specificity measures the true negative rate i.e., the test’s ability to correctly identify those without the disease, among those with and without the disease respectively.
The sensitivity and specificity can be calculated by using the following formulae:
Sensitivity = True Positive / (True Positive + False Negative)
Specificity = True Negative / (False Positive + True Negative)
Please click this link to read the formulae and calculations for Sensitivity and Specificity with an example using data from the study conducted by Capra et al (2).
How Sensitivity and Specificity Help:
If the sensitivity of a test is high, the clinician can be more confident that the test accurately identifies patients who have the disease. This reduces the likelihood of missing a diagnosis (false negatives) and ensures that those with the condition are correctly identified and can receive appropriate treatment.
If the specificity of a test is high, the clinician can be more confident that the test accurately identifies patients who do not have the disease. This reduces the likelihood of incorrectly diagnosing the condition (false positives) and prevents unnecessary treatments or further testing for patients who are actually disease-free.
2. Diagnostic test performance:
2.1 Positive and negative predictive values:
When selecting a diagnostic test, clinicians should consider its sensitivity and specificity. However, to evaluate the test’s performance against a gold standard, the predictive values should be used.
Positive predictive value (PPV) indicates the percentage of individuals with a positive test result who actually have the disease, while negative predictive value (NPV) indicates the percentage of individuals with a negative test result who do not have the disease.
The positive predictive value and negative predictive value can be calculated by using the following formulae:
Positive Predictive Value = True Positive / (True Positive + False Positive)
Negative Predictive Value = True Negative / (False Negative + True Negative)
Please click this link to read the formulae and calculations for Positive Predictive Value (PPV) and Negative Predictive Value (NPV) with an example using data from the study conducted by Capra et al (2).
How predictive values help:
If the PPV is high, the clinician can be more confident that a positive result indicates the presence of the disease, leading to more accurate diagnosis and appropriate treatment.
If the NPV is high, a negative result is a strong indicator that the patient does not have the disease, which helps avoid unnecessary further testing or treatment.
2.2 Positive and negative likelihood ratios:
The next key question one must ask while evaluating the diagnostic test’s performance (or while interpreting diagnostic test results) is: “How much more or less likely does the diagnostic test’s efficacy in affected patients differ from those in unaffected individuals?” (3).
Integrating the diagnostic test’s efficacy with pretest probability (i.e. refers to the likelihood that a patient has a particular disease before a diagnostic test is performed, based on factors such as clinical history, symptoms, and epidemiological data) or clinical intuition helps determine the likelihood of the disease being actually present, or the post-test probability.
How can we integrate the diagnostic test’s efficacy with pretest probability or clinical intuition, to determine likelihood of a disease being present, or post-test probability? The answer is – through likelihood ratios.
Likelihood ratios indicate how much the probability of a disease in a patient is altered by the test result. These ratios compare the probability of a particular test result in patients with the disease to the probability of the same result in patients without the disease.
Likelihood ratios (LRs) range from zero to infinity. An LR below 1 indicates that a test result reduces the likelihood of disease, while an LR above 1 suggests that it increases the likelihood of disease. An LR of 1 means that the test does not alter the probability of disease, as it is equally likely to be positive or negative in both those with and without the condition, making it of limited diagnostic value.
The likelihood ratios (positive and negative) can be calculated by using the following formulae:
+ LR = sensitivity / (1- specificity)
– LR = (1- sensitivity) / specificity
Please click this link to read the formulae and calculations for Likelihood Ratios (LRs) with an example using data from the study conducted by Capra et al (2).
Here is a quick example:
Imagine a patient with a pretest probability of 25% for a disease. If a diagnostic test has:
Positive Likelihood Ratio (LR+) of 5: A positive test result would increase the post-test probability of the disease. If the pretest probability is 25%, applying an LR+ of 5 might increase the post-test probability to about 55%.
Negative Likelihood Ratio (LR-) of 0.2: A negative test result would decrease the post-test probability of the disease. With a pretest probability of 25%, applying an LR- of 0.2 might reduce the post-test probability to about 10%.
Therefore, likelihood ratios are mathematical tools available for refining the diagnosis by adjusting the pretest probability with test results, leading to more informed clinical decisions and better patient management.
How likelihood ratios help:
1. Refining Diagnosis
LRs help update the pretest probability of a disease based on the result of a diagnostic test. By applying the LR to the pretest probability, clinicians can calculate the post-test probability, which provides a more accurate estimate of whether the patient has the disease.
2. Interpreting Test Results
Positive Likelihood Ratio (LR+): Indicates how much more likely a positive test result is in patients with the disease compared to those without it. A high LR+ means that a positive result significantly increases the probability of disease.
Negative Likelihood Ratio (LR-): Indicates how much less likely a negative test result is in patients with the disease compared to those without it. A low LR- means that a negative result significantly decreases the probability of disease.
3. Clinical Decision-Making
High LR+: A high LR+ (e.g., 10) suggests that a positive test result greatly increases the likelihood of the disease. For example, if the pretest probability of a disease is 20% and the LR+ is 10, the post-test probability will rise significantly, often leading to a confirmation of the diagnosis and initiation of treatment.
Low LR-: A low LR- (e.g., 0.1) indicates that a negative test result greatly reduces the likelihood of the disease. If the pretest probability is 30% and the LR- is 0.1, the post-test probability will drop considerably, often allowing clinicians to rule out the disease and avoid unnecessary further testing.
4. Making Diagnostic Decisions
Diagnostic Test Selection: LRs help in choosing the most appropriate diagnostic tests by comparing how much different tests alter the probability of disease. Tests with high LRs are preferred when confirmation of disease is needed, while tests with low LRs are useful for ruling out conditions.
Treatment Decisions: Accurate post-test probabilities help in deciding whether to start, continue, or modify treatment based on the updated likelihood of the disease.
To apply likelihood ratios (LRs), the pretest probability of the disease or the initial clinical suspicion should be converted into pretest odds using the formula:
Pretest Odds = Probability / (1 – Probability)
Then, multiply the pretest odds by the likelihood ratio to obtain the post-test odds using the formula:
Post-Test Odds = Pretest Odds × LR
To return to a probability format, which is commonly used by clinicians, convert the post-test odds back using the formula:
Post-Test Probability = Post-Test Odds / (1 + Post-Test Odds)
An example calculation to illustrate how to use likelihood ratios (LRs) with pretest and post-test odds:
Scenario: Suppose a patient has a pretest probability of 30% for a certain disease. A diagnostic test is performed, and the results provide a likelihood ratio (LR) of 8 for a positive result.
Step-by-Step Calculation:
1. Convert Pretest Probability to Pretest Odds:
Pretest Probability: 30% (or 0.30)
Pretest Odds = 0.30 / (1 − 0.30) = 0.30 / 0.70 ≈ 0.43
2. Calculate Post-Test Odds Using the Likelihood Ratio:
Likelihood Ratio (LR+): 8
Post-Test Odds = 0.43 × 8 = 3.44
3. Convert Post-Test Odds to Post-Test Probability:
Post-Test Probability = 3.44 / (1 + 3.44) = 3.44 /4.44 ≈ 0.78 or 78%
Summary:
Pretest Probability: 30%
Pretest Odds: 0.43
Likelihood Ratio (LR+): 8
Post-Test Odds: 3.44
Post-Test Probability: 78%
With a pretest probability of 30% and a positive test result with an LR of 8, the post-test probability of the disease increases to approximately 78%. This demonstrates how the test result significantly impacts the likelihood of the disease based on the pretest odds and likelihood ratio.
Interpreting likelihood ratios (LRs):
– A positive likelihood ratio (LR+) of 10 or higher indicates that the test is highly effective at correctly identifying the disease when the test result is positive.
– A negative likelihood ratio (LR-) of 0.1 or lower suggests that the test is highly effective at correctly ruling out the disease when the test result is negative.
– An LR close to 1.0 implies that the test does not significantly alter the probability of having or not having the disease, as it provides little additional diagnostic value.
3. Use of a nomogram:
Alternatively, a nomogram can simplify the process by eliminating the need for calculations or estimates. It works by drawing a line from the pretest probability through the likelihood ratio (positive and then negative) to determine the post-test probability directly.
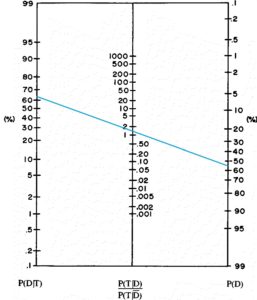
where,
P(D) = the probability that the patient has the disease before the test,
P(D|T) = the probability that the patient has the disease after the test result.
P(T|D) = the probability of the test result if the patient has the disease,
P(T|D̄) = the probability of the test result if the patient does not have the disease.
4. Combining the diagnostic test characteristics and performance metrics to help with diagnosis:
The test characteristics, such as sensitivity and specificity, are important for selecting appropriate diagnostic tests. The metrics such as positive and negative predictive values, and positive likelihood ratio (LR+) and negative likelihood ratio (LR-), are used to explain the diagnostic test performance. However, there are no straightforward methods for combining these different indicators. Researchers have proposed various approaches to integrate diagnostic test indices effectively to support decision-making in patient care.
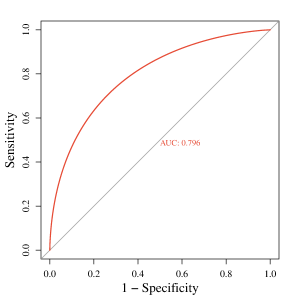
1. Receiver Operator Characteristic (ROC) curves
Receiver Operating Characteristic (ROC) curves illustrate how sensitivity and specificity vary with different cutoff points for a diagnostic test and allow for comparison between tests for the same condition. These curves plot the true positive rate (sensitivity) on the vertical axis against the false positive rate (1-specificity) on the horizontal axis for various cutoff values.
ROC curves help determine the optimal cutoff to minimize false positives and false negatives. The test’s overall performance can be assessed by calculating the area under the ROC curve (AUC). An AUC close to 0.50 indicates a test with poor performance, where the curve is diagonal, reflecting equal true and false positive rates. In contrast, an excellent test will have a steep ROC curve approaching the upper left corner, with an AUC of 1.0, indicating perfect sensitivity and specificity.
2. Diagnostic accuracy
Diagnostic accuracy measures the likelihood that a test will correctly classify an individual, calculated as the sum of true positives and true negatives divided by the total number of individuals tested.
This measure reflects a weighted average of sensitivity and specificity, where sensitivity is adjusted by the prevalence of the condition in the study population, and specificity is adjusted by the complement of the prevalence. However, diagnostic accuracy rarely aligns closely with both sensitivity and specificity, except in cases where these values are nearly equal or when the disease prevalence is around 50%. While diagnostic accuracy might seem like a straightforward indicator of test validity, its reliance on prevalence limits its effectiveness compared to a more nuanced evaluation of individual test characteristics and performance.
The diagnostic accuracy can be calculated by using the following formulae:
Diagnostic Accuracy = (TP + TN) / Total
For example, if the results from a diagnostic test are Total = TP + TN + FP + FN = 80 + 70 + 10 + 20 = 180,
then, the diagnostic accuracy = (TP + TN) / Total = (80 + 70) / 180 ≈0.83
This means that the diagnostic test correctly classifies the individual as either having or not having the disease 83% of the time.
However, the diagnostic accuracy changes with disease prevalence. Similarly, predictive values are influenced by prevalence: as prevalence decreases, the positive predictive value declines while the negative predictive value increases. Whereas, positive and negative likelihood ratios and the area under the ROC curve are derived solely from sensitivity and specificity and remain unaffected by disease prevalence.
3. Diagnostic odds ratio
The diagnostic odds ratio (DOR) is a comprehensive measure of test performance that integrates sensitivity and specificity, offering a prevalence-independent assessment similar to accuracy.
The odds ratio quantifies the strength of the association between an exposure (in our case, clinical diagnostic test result) and the presence of disease (gold standard test result).
The DOR is calculated as the ratio of the odds of a positive test result in individuals with the disease to the odds of a positive result in those without the disease. Values of the DOR range from 0 to infinity, with higher values indicating superior test performance in distinguishing between diseased and non-diseased individuals.
1. Using Sensitivity and Specificity: Diagnostic Odds Ratio (DOR) = (TP / FN) / (FP / TN) = (sensitivity / (1 – sensitivity)) / ((1 – specificity) / specificity)
2. Using Predictive Values and Likelihood Ratios: Diagnostic Odds Ratio (DOR) = (TP / FP) / (FN / TN) = (PPV / (1 – PPV)) / ((1 – NPV) / NPV) = LR+ / LR-
Evaluating diagnostic tests using multiple individual metrics like sensitivity and specificity can be complex. As DOR provides a single measure of diagnostic performance, it is useful for comparing different diagnostic tests. Therefore, using the DOR is often preferred for reporting and comparing test performance.
Understanding how to integrate test characteristics and performance, and how to interpret these results, is important for making evidence-based diagnostic decisions. In the following sections, we will work through a detailed example calculation using data from Capra et al. (2) to demonstrate these processes.
Reference:
1. Tawa N, Rhoda A, Diener I. Accuracy of clinical neurological examination in diagnosing lumbo-sacral radiculopathy: a systematic literature review. BMC Musculoskelet Disord. 2017 Feb 23;18(1):93. doi: 10.1186/s12891-016-1383-2. PMID: 28231784; PMCID: PMC5324296.
2. Capra, F., Vanti, C., Donati, R., Tombetti, S., O’reilly, C. and Pillastrini, P., 2011. Validity of the straight-leg raise test for patients with sciatic pain with or without lumbar pain using magnetic resonance imaging results as a reference standard. Journal of manipulative and physiological therapeutics, 34(4), pp.231-238.
3. Sackett DL, Haynes RB. Evidence Base of Clinical Diagnosis: The architecture of diagnostic research. BMJ. 2002;324:539-41.