Post-test probability: is the probability of the presence of a disease after a confirmatory diagnostic test.
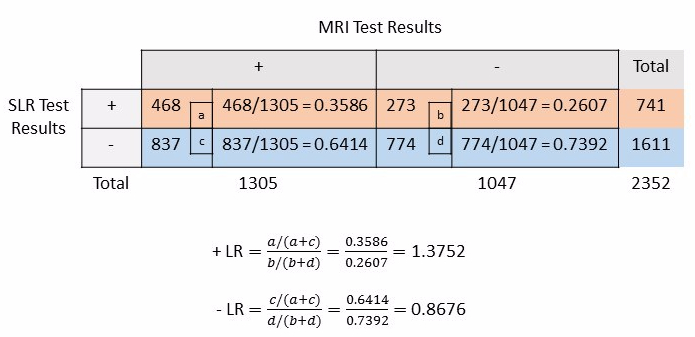
Method I: Let us estimate post-test probability by hand calculation using the data from the study by Capra et al (1). To do this, we need to know the pre-test probability and the positive likelihood ratio values.
For this purpose, let us assume the pre-test probability as 0.55. And, we will use the likelihood ratio value from Capra et al (1) study.
The likelihood ratios are:

Step I: Calculate pre-test odds from pre-test probability.

Step II: Calculate post-test odds by multiplying pre-test odds and positive likelihood ratio.

Step III: Calculate post-test probability from post-test odds.

The post-test probability or the probability of having the disease after performing the diagnostic test is 62.65%.
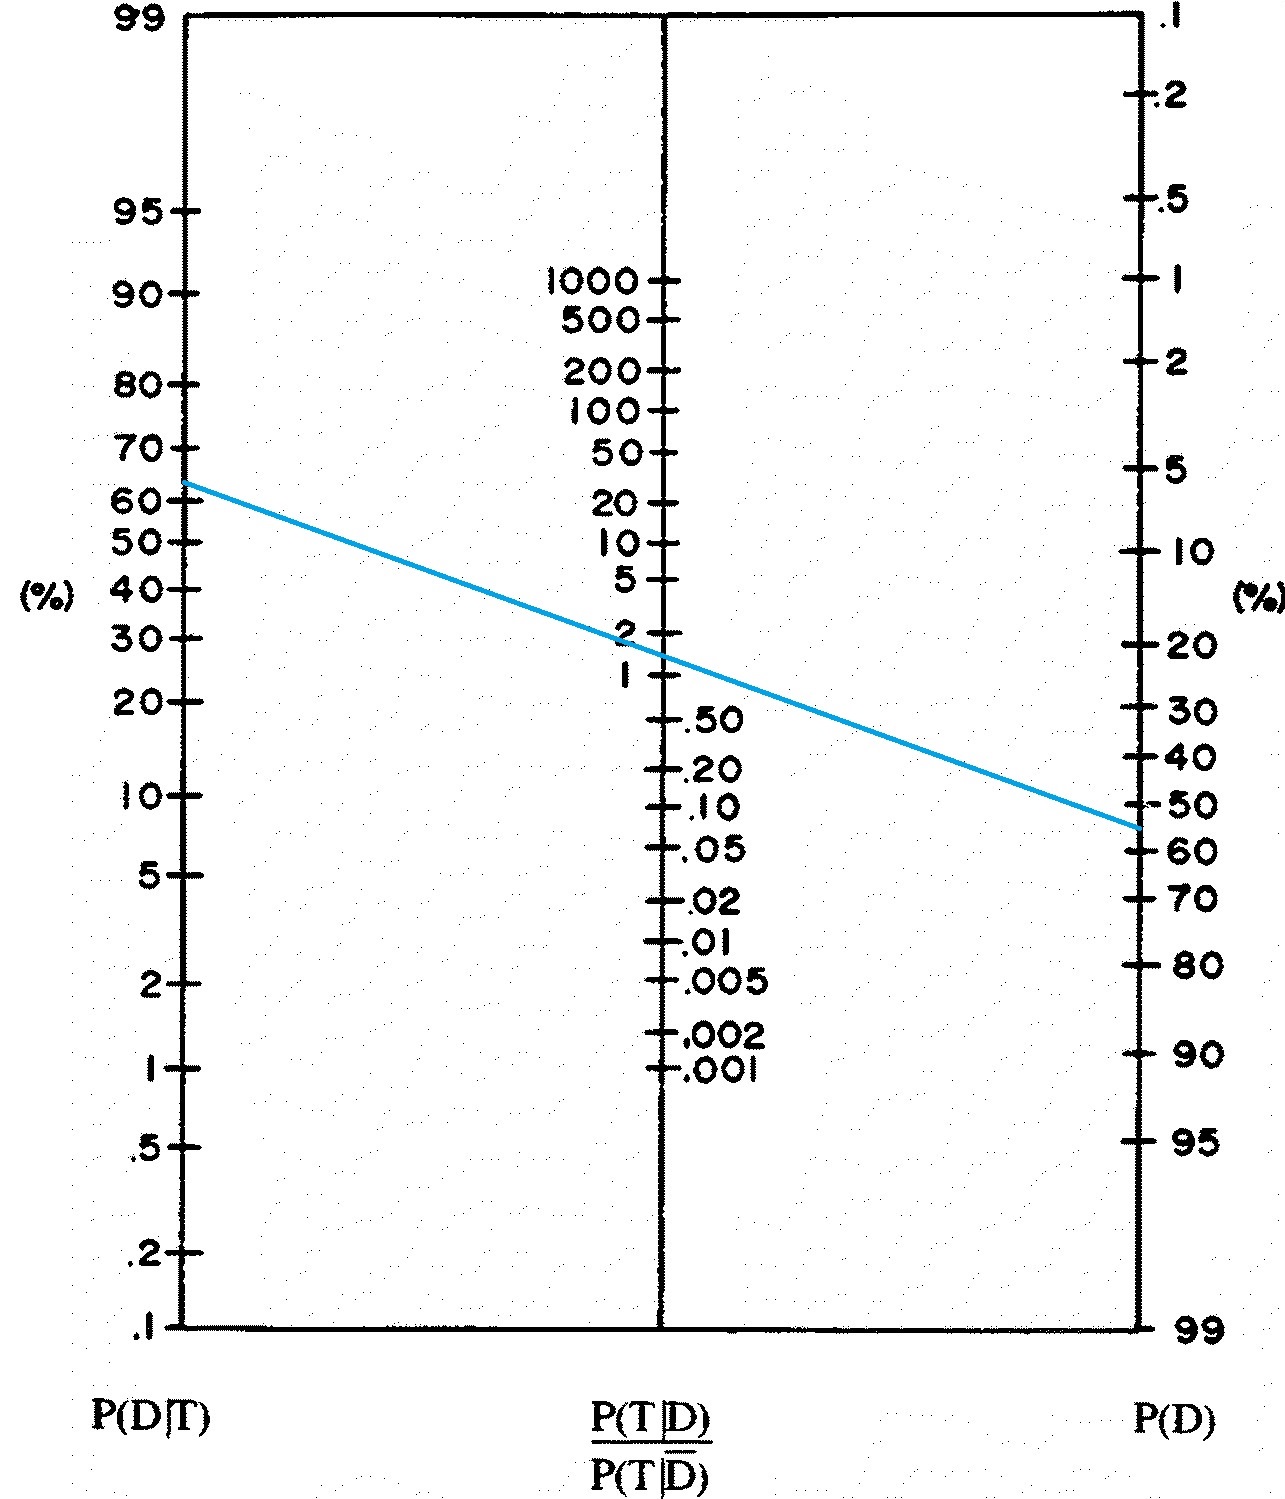
Method II: Now, let us estimate post-test probability using Fagan’s nomogram for Bayes theorem (2). To do this, we need to know pre-test probability and positive likelihood ratio values. Let us use the same values as mentioned in the method above.
viz., pre-test probability = 0.55; positive likelihood ratio = 1.3752
The Fagan’s nomogram has three calibrated vertical lines (2). The vertical line on the right represents the pre-test probability. The line in the middle represents the positive likelihood ratio. The line on the left represents the post-test probability of having the disease.

where,
P(D) = the probability that the patient has the disease before the test,
P(D|T) = the probability that the patient has the disease after the test result.
P(T|D) = the probability of the test result if the patient has the disease,
P(T|D̄) = the probability of the test result if the patient does not have the disease.
Step I: Draw a straight line connecting the pre-test probability i.e., P(D) value, 0.55 or 55% and positive likelihood ratio i.e., [P(T|D) / P(T|D̄)] value, 1.3752.
Step II: Now, extend the line to intersect the calibrated vertical line on the left to determine the post-test probability, P(D|T).
We find that the straight line intersects the post-probability vertical line between 60% to 70%, approximately at 63% or 0.63. This value is very close to the actual value (0.6265) calculated by hand.
References:
- Capra, F., Vanti, C., Donati, R., Tombetti, S., O’reilly, C. and Pillastrini, P., 2011. Validity of the straight-leg raise test for patients with sciatic pain with or without lumbar pain using magnetic resonance imaging results as a reference standard. Journal of manipulative and physiological therapeutics, 34(4), pp.231-238.
- Fagan TJ. Letter: nomogram for Bayes theorem. The New England journal of medicine. 1975;293(5):257.