1. Introduction To The Guide To Good Prescribing
Prescribing is a complex task that must be grounded in evidence-based principles. Safe and effective prescribing is a practical skill that should be taught to trainees and evaluated using models like the WHO Guide to Good Prescribing (Tichelaar, J, et al. 2020), which provides an evidence-based framework for drug prescription. According to WR Thompson et al. (2020), the senior editor of ACSM’s Guidelines for Exercise Testing and Prescription, 8th ed., “Exercise is a ‘medicine’ that can prevent and treat chronic disease; those who ‘take it’ live longer and with a higher quality of life.”
In my opinion, healthcare professionals who prescribe ‘exercise’ should follow similar evidence-based principles as outlined in the WHO Guide to Good Prescribing (Tichelaar, J, et al. 2020), to ensure safe and effective use of exercise as medicine in clinical populations.
‘Exercise’ is a structured, intentional form of physical activity in which the patient actively generates force, typically through planned, repetitive movements designed to improve or maintain physical fitness, such as during rehabilitation or workout routines. Exercise, as prescribed by health professionals and outlined by the ACSM, involves specific recommendations for frequency, intensity, time (or duration), and type of activity—commonly known as the FITT components (Liguori & ACSM, 2020). These, along with the volume and progression of exercise (FITT-VP), are used to enhance key fitness components such as muscular strength, endurance, flexibility, and neuromotor function (Liguori & ACSM, 2020).
Similarly, manual therapy refers to a specific form of clinician-generated force applied to patients’ body segment. This therapeutic approach includes techniques such as joint mobilization, manipulation, and soft tissue techniques, with the goal of improving mobility, reducing pain, and enhancing function. Manual therapy is prescribed based on individual assessment and diagnosis, utilizing various grades of force. The techniques used in manual therapy are guided by evidence-based protocols and are tailored to the patient’s specific needs and conditions, similar to how exercise prescriptions are adjusted according to the FITT-VP principles (Clar C, et al. 2014; Liguori & ACSM, 2020).
Prescribing an intervention — whether exercise or manual therapy — requires a thorough understanding of the steps to ‘Good Prescribing’ published by Tichelaar, J, et al. 2020:
Step 1: Define the patient’s problem
Step 2: Specify the therapeutic objective – what do you want to achieve with the intervention?
Step 3: Verify the suitability of your personalized intervention – check effectiveness and safety
Step 4: Start the treatment
Step 5: Give information, instructions and warnings
Step 6: Monitor (and stop) treatment
Here is an example of prescribing an effective personalized intervention that I have adapted from Tichelaar, J, et al. 2020:
Step 1: Define the diagnosis – Fibromyalgia
Step 2: Specify the therapeutic objective – To decrease the intensity of pain
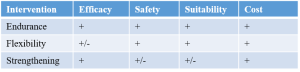
Step 3: Make an inventory of effective types of intervention from clinical practice guidelines – Endurance, Flexibility, Strengthening (Brosseau, L, et al. 2008, Parts 1 and 2)
Step 4: Choose an effective type of intervention considering meta-analyses or individual studies – Endurance (Brosseau, L, et al. 2008, Part 1)
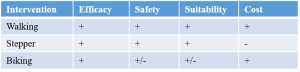
Step 5: Choose a personalized intervention – Walking
2. How To Prescribe An Intervention From Research Evidence?
To successfully prescribe an effective personalized intervention from available research evidence as mentioned in the steps 3 to 5 above, it necessary to understand:
– the measures of effect size and risk,
– how it applies to individual patients, and
– how to communicate the effectiveness of interventions in clinical practice for shared decision making.
In the following sections, I will outline the measures of effect size and risk with example calculations, explain their relevance to individual patients, and provide a ‘Step-by-Step Guide To Prescribe An Intervention’ from available research evidence using these measures to communicate treatment plans effectively.
2.1 Measures of Effect Size
Effect size is a broad term that refers to various statistical measures used to quantify the magnitude of a treatment effect or the strength of an association between variables. It provides a way to understand the practical significance of a finding, not just its statistical significance.
Measures of Effect Size: Cohen’s d, Standardized Mean Difference (SMD) in Meta-Analysis.
2.1.1 Cohen’s d: Measures the difference between two means in standard deviation units. It’s often used in studies comparing two groups to determine how large the difference is relative to the variability within the groups.
The formula for Cohen’s d is:
Cohen’s d = Mean Difference / Pooled Standard Deviation
Cohen’s d values are typically interpreted as follows:
Small Effect: d = 0.2
Medium Effect: d = 0.5
Large Effect: d = 0.8 or higher
For example, if Group A: Mean1 = 80, Standard Deviation1 (SD1) = 15, Sample Size = 30 and Group B: Mean2 = 60, Standard Deviation2 (SD2) = 20, Sample Size = 30:
Mean Difference = 80 − 60 = 20
Pooled SD = sqrt(((n1 – 1) * SD1^2 + (n2 – 1) * SD2^2) / (n1 + n2 – 2)) = sqrt(((30 – 1) * 15^2 + (30 – 1) * 20^2) / (30 + 30 – 2)) = sqrt(504.37) ≈ 17.68
Where:
n1 = Sample size of Group 1
SD1 = Standard deviation of Group 1
n2 = Sample size of Group 2
SD2 = Standard deviation of Group 2
Cohen′s d = 20 / 17.68 ≈ 1.13
A higher Cohen’s d value (0.8 or higher) indicates a larger effect size.
2.1.2 Standardized Mean Difference (SMD) in Meta-Analysis (Weighted Cohen’s d): SMD is a general term that refers to any effect size that standardizes the difference between group means. It can refer to various effect size indices, like Cohen’s d, Hedges’ g, or Glass’s Δ. Each of these is calculated slightly differently based on the sample size or the specific variance used (e.g., Hedges’ g includes a correction for small sample sizes, Glass’s Δ is used when variances between the two groups are unequal).
Hedges’ g is used when sample sizes are small (usually 𝑛<20). The correction factor reduces the bias in small sample sizes.
Hedges’ g = d * [1 – (3 / (4*(n1 + n2 – 2) – 1))]
Where:
– d is Cohen’s d
– n1 and n2 are the sample sizes of the two groups
Glass’s Δ uses the standard deviation of one of the groups, usually the control group, rather than the pooled standard deviation. It’s useful when variances between the two groups are unequal.
Glass’s Δ = (Mean1 – Mean2) / SD control
Where:
– Mean1 and Mean2 are the means of the two groups
– SD control is the standard deviation of the control group
SMD in Meta-Analysis (Weighted Cohen’s d)
In meta-analysis, SMD can be weighted to account for sample size, often by using an inverse variance weighting scheme.
The general formula used in meta-analysis is:
SMD = Mean1 − Mean2 / Pooled Standard Deviation
However, the pooled standard deviation is calculated differently depending on the variance estimate (from within studies in meta-analysis).
A commonly used weighted formula is:
𝑆𝑀𝐷 meta = ∑𝑤𝑖 𝑆𝑀𝐷𝑖 / ∑𝑤𝑖
Where:
𝑤𝑖 is the inverse variance weight for each study.
𝑆𝑀𝐷𝑖 is the SMD for each individual study.
This measure is used to compare the means of different studies or interventions, in meta-analyses. It expresses the difference between two group means in standard deviation units, allowing for comparison across studies with different measurement scales.
SMD values are typically interpreted as follows:
Small Effect: SMD ≈ 0.2
Medium Effect: SMD ≈ 0.5
Large Effect: SMD ≈ 0.8
For example, if Group A has a mean score of 70, Group B has a mean of 50, and the pooled standard deviation is 25:
SMD = 70 − 50 / 25 = 0.8
This represents a large effect size.
2.2 Measures of Risk:
Measures of Risk: Odds Ratio (OR), Risk Difference (RD), Number Needed to Treat (NNT), Relative Risk (RR), Relative Risk Difference (RRD).
2.2.1 Odds Ratio (OR): Used in case-control studies to compare the odds of an event occurring in an experimental group versus a control group. It helps to assess the strength of the association between exposure and outcome.
The formula for calculating the Odds Ratio is:
OR = Odds of Outcome in Intervention Group / Odds of Outcome in Control Group
Let’s use a hypothetical clinical trial with two groups, each containing 200 patients:
Control Group: 40 patients experience the event, and 160 patients do not.
Experimental Group: 40 patients experience the event, and 160 patients do not.
Step 1: Calculate the Odds of the Event
Control Group: Odds of Event = 40 / 160 = 0.25
Experimental Group: Odds of Event = 40 / 160 = 0.25
Step 2: Calculate the Odds Ratio
OR = Odds of Event in Experimental Group / Odds of Event in Control Group = 0.25 / 0.25 = 1
An OR of 1 means that the odds of the event occurring are the same in both the experimental and control groups. There is no association between the intervention and the event in this example.
If the OR had been greater than 1, it would suggest that the event is more likely in the experimental group compared to the control group. If the OR had been less than 1, it would suggest that the event is less likely in the experimental group compared to the control group.
2.2.2 Risk Difference (RD): Measures the absolute difference in event rates between the control group and the experimental group.
The Risk Difference (RD) is an important measure, which represents the absolute difference between the control event rate (CER) and the experimental event rate (EER):
RD = CER − EER
Let’s consider a hypothetical clinical trial with two groups, each containing 200 patients:
Control Group: 40 patients experience the event.
Control Group Event Rate (CER) = 40/200 = 0.20 (or 20%)
Experimental Group: 40 patients experience the event.
Experimental Group Event Rate (EER) = 40/200 = 0.10 (or 10%)
When 20% of patients in the control group experience an adverse event (CER = 0.20) compared to 10% in the experimental group (EER = 0.10), the RD would be:
RD = 0.20 – 0.10 = 0.10 (or 10%)
This indicates a 10% absolute reduction in the event rate due to the intervention.
However, RD depends on baseline risk which may vary with different populations, making it a less consistent measure of effectiveness across different studies and populations.
2.2.3 Number Needed to Treat
The Number Needed to Treat (NNT) is another important measure derived from the RD, indicating how many patients need to be treated to prevent one additional adverse event:
NNT = 1 / RD
Using the previous example:
NNT = 1 / 0.10 = 10
This means that treating 10 patients with the intervention would prevent one adverse event.
2.2.4 Relative Risk (RR)
Relative Risk (RR) compares the probability of an event occurring in the experimental group to that in the control group. It provides insight into how much the intervention changes the risk:
RR = EER / CER
Using the previous data, when 10% of patients in the experimental group experience an event (EER = 0.10) compared to 20% in the control group (CER = 0.20), the RR would be:
RR = 0.10 / 0.20 = 0.5
This suggests that the experimental group has half the risk of experiencing the event compared to the control group.
2.2.5 Relative Risk Reduction (RRR)
Relative Risk Reduction (RRR) reflects the proportional decrease in risk due to the intervention, calculated as:
RRR = RD / CER
or RRR = 1 − RR
Using the earlier data:
RRR = 1 − 0.50 = 0.50 (or 50%)
This indicates a 50% reduction in risk for those receiving the intervention compared to the control group.
3. Step-by-Step Guide To Prescribe An Intervention Using Cohen’s d and Number Needed To Treat From A Randomized Controlled Study
In this section, I will break down the process of prescribing an intervention selected from a Randomized Controlled Trial (RCT) to a patient.
To explain how to prescribe an intervention using the concept of Cohen’s d and NNT, we’ll work through the application step-by-step using the study by Poulsen et al. (2013) as an example. The study compared the effectiveness of patient education (PE) with or without manual therapy (MT) to a minimal control intervention (MCI) in patients with hip osteoarthritis (OA).
Step 1: Understanding the Context
The study aimed to investigate the effectiveness of patient education (PE) alone or combined with manual therapy (MT) against a minimal control intervention (MCI) in reducing pain severity in patients with hip OA. The primary outcome was the self-reported pain severity on an 11-point numeric rating scale (NRS).
Intervention Group 1: Patient Education (PE)
Intervention Group 2: Patient Education + Manual Therapy (PE + MT)
Control Group: Minimal Control Intervention (MCI)
Step 2: Interpreting Cohen’s d
Cohen’s d is a measure of effect size that expresses the difference between two group means in terms of standard deviation units. It helps quantify the magnitude of the treatment effect, making it easier to interpret the practical significance of the results.
In the study, the effect size (Cohen’s d) for the PE + MT group versus the MCI group was calculated as 0.92. This value indicates how much the pain severity was reduced in the PE + MT group compared to the MCI group, measured in standard deviation units.
A Cohen’s d of 0.92 suggests a large effect size, indicating that the combined intervention of PE + MT had a substantial impact on reducing pain severity compared to the MCI group.
Interpreting Confidence Intervals (CI): The 95% confidence interval (CI) was 0.9 to 2.9, which means the true reduction in pain could be as small as 0.9 points or as large as 2.9 points. Since the CI does not cross 0, we can be confident that this effect is both statistically significant and clinically meaningful.
Step 3: Interpreting Number Needed to Treat (NNT)
NNT indicates how many patients need to be treated with a particular intervention to achieve one additional beneficial outcome compared to a control group.
In the study by Poulsen et al. (2013), the NNT for the combined Patient Education + Manual Therapy (PE + MT) intervention was 3 (95% CI: 2–7).
This means that for every 3 patients treated with the combined intervention, 1 additional patient would experience a significant reduction in pain compared to those receiving the Minimal Control Intervention (MCI).
NNT of 3 is considered a highly favorable result. It suggests that only 3 patients need to be treated with PE + MT to achieve one additional patient reporting meaningful pain relief.
This low NNT reflects the effectiveness of the combined PE + MT intervention.
Interpreting Confidence Intervals for NNT: The narrow confidence interval (CI = 2 to 7) indicates moderate precision of the estimate, suggesting that the intervention is consistently beneficial, although the exact number of patients who benefit may vary between 2 and 7.
Step 4. Communicating to Patients: When discussing treatment options with patients, explain that the PE + MT intervention is expected to produce a substantial improvement in pain based on the results of this study:
“Research suggests that the combined PE and MT treatment can significantly reduce pain in patients like you, with effects much larger than those who have received minimal intervention. For every 3 patients treated with this combination of education and manual therapy, one will experience a significant reduction in pain, making this a very effective option. We’ll also monitor your response and adjust the plan as necessary to ensure it’s working effectively for you.”
While prescribing clinical interventions, the combination of metrics like Cohen’s d (effect size) and Number Needed to Treat (NNT) provides a comprehensive view of both the magnitude and practical impact of a treatment. The study by Poulsen et al. (2013) demonstrated that the combined PE + MT intervention has a large effect size (Cohen’s d = 0.92) and a favorable NNT of 3, making it a robust and effective option for managing pain in patients with hip osteoarthritis. Clinicians can confidently prescribe this intervention, knowing it is both statistically and clinically significant for improving patient outcomes.
While the discussion highlights the benefits of the intervention, it’s equally important to consider any potential risks or side effects associated with manual therapy (MT). While patient education (PE) alone is generally very safe, MT may carry rare risks, such as discomfort during sessions or an exacerbation of symptoms. Therefore, the Number Needed to Treat (NNT) should always be interpreted in conjunction with the Number Needed to Harm (NNH) if available, to provide a balanced understanding of both the potential benefits and risks.
4. Step-by-Step Guide To Prescribe An Intervention Using Standardized Mean Difference (SMD) and Number Needed to Treat (NNT) From a Systematic Review and Meta-Analysis
This guide breaks down the use of Standardized Mean Difference (SMD) and Number Needed to Treat (NNT) to communicate intervention effectiveness to patients, using data from a systematic review and meta-analysis published by Pourahmadi et al. (2021). This meta-analysis evaluated the effectiveness of dry needling for headache treatment.
Step 1: Understanding the Context
The systematic review investigated the effects of dry needling on pain intensity and related disability in patients with Tension-Type Headache (TTH), Cervicogenic Headache (CGH), and migraine. The aim was to determine whether dry needling provides superior benefits over other interventions.
Intervention Group: Patients receiving dry needling.
Control Group: Patients receiving alternative treatments or no intervention.
Step 2: Interpreting Standardized Mean Difference (SMD)
SMD quantifies the difference in effect between two groups, expressed in standard deviation units. It helps compare results across studies with different scales.
For TTH pain intensity, the SMD was −1.27 (95% CI = −3.56 to 1.03). This indicates a large reduction in pain, but since the confidence interval spans both negative and positive values, it includes the possibility of no effect (CI includes zero), making the result statistically non-significant.
For CGH pain intensity, the SMD was −0.41 (95% CI = −4.69 to 3.87), suggesting a small improvement that is also statistically non-significant, as the confidence interval is wide and crosses zero.
For TTH-related disability, the SMD was −2.28 (95% CI = −2.66 to −1.91), indicating a large, statistically significant effect since the entire confidence interval is negative, showing consistent improvement.
For CGH-related disability, the SMD was −0.72 (95% CI = −1.09 to −0.34), reflecting a moderate and statistically significant improvement, as the confidence interval does not include zero.
Interpreting Confidence Intervals (CI): A narrower confidence interval suggests greater precision in the estimate, while a wider one indicates more variability or uncertainty in the effect size. In the case of TTH disability (SMD = −2.28, 95% CI = −2.66 to −1.91), the interval is narrow, suggesting a reliable and significant improvement in disability. For CGH pain intensity, the wide CI (−4.69 to 3.87) reflects uncertainty and non-significance.
Step 3: Interpreting Number Needed to Treat (NNT)
NNT tells you how many patients need to be treated to achieve one additional positive outcome.
For TTH pain reduction, the NNT was 2, meaning 2 patients must be treated for 1 patient to experience significant pain relief. The CI (1.5 to 2.7) shows that this effect is likely consistent, with a small range of possible outcomes.
For TTH disability, the NNT was 1, indicating that every patient treated with dry needling experienced an improvement in disability. This is an exceptionally favorable result, supported by a narrow confidence interval.
For CGH pain reduction, the NNT was 4 (95% CI = 3 to 6), indicating a modest benefit. The CI here suggests that treating between 3 to 6 patients will lead to one experiencing meaningful pain reduction, demonstrating some uncertainty but still clinically valuable.
For CGH disability, the NNT was 3 (95% CI = 2 to 5), indicating that treating 3 patients will likely improve disability for 1 patient. The CI shows that this effect is relatively consistent.
Interpreting Confidence Intervals for NNT: A narrow CI (e.g., NNT for TTH pain reduction = 2, CI = 1.5 to 2.7) suggests that the NNT is a reliable estimate with little variability. A wider CI indicates more uncertainty about how many patients will benefit, as seen in the CGH pain reduction NNT (4, CI = 3 to 6), but still suggests the treatment is beneficial.
Step 4: Communicating to Patients
When discussing treatment options, convey the effectiveness in simple terms:
“For patients like you with tension-type headaches, dry needling has been shown to reduce pain in 1 out of every 2 people treated. Additionally, every patient treated has experienced improvements in daily functioning and disability related to headaches. For cervicogenic headaches, dry needling reduces pain in 1 out of every 4 patients and improves disability in 1 out of every 3 patients, making it a highly beneficial option.”
The combination of SMD and NNT from Pourahmadi et al. (2021) provides a clear picture of dry needling’s effectiveness for headache treatment. The study demonstrates that dry needling offers significant benefits, particularly for reducing disability in TTH and CGH patients. While further studies are needed, the evidence supports the use of dry needling as a treatment for headache-related pain and disability, with high NNT values indicating substantial clinical relevance.
5. Step-by-Step Guide To Prescribe An Intervention Using Odds Ratio (OR) and Number Needed to Treat (NNT) From a Systematic Review and Meta-Analysis
In this section, I will break down the process of prescribing an intervention selected from a systematic review and meta-analysis to a patient.
To explain how to prescribe an intervention using the concepts of Odds Ratio (OR) and Number Needed to Treat (NNT), we’ll work through the application step-by-step using the study by Orrow et al. (2012) as an example. This meta-analysis evaluated the effectiveness of primary care-based physical activity promotion interventions in sedentary adults.
Step 1: Understanding the Context
The systematic review aimed to determine the sustained effects of physical activity promotion interventions in primary care for sedentary adults. The study primarily measured the number of patients achieving recommended physical activity levels at 12 months.
Intervention Group: Received advice or counseling promoting physical activity, delivered in primary care, through face-to-face or telephone contact.
Control Group: Received no physical activity promotion or minimal intervention.
Step 2: Interpreting the Odds Ratio (OR)
Odds Ratio (OR) quantifies the odds of an event occurring (in this case, achieving the recommended levels of physical activity) in the intervention group compared to the control group.
In the study by Orrow et al. (2012), the pooled Odds Ratio for achieving recommended physical activity levels was 1.42 (95% CI: 1.17–1.73).
This means the odds of meeting the recommended physical activity levels in the intervention group were 1.42 times higher than in the control group.
An OR of 1.42 suggests a 42% higher likelihood of achieving recommended activity levels when exposed to the intervention compared to the control group.
Interpreting Confidence Intervals (CI): The 95% confidence interval (1.17 to 1.73) suggests that the true odds ratio likely lies between 1.17 and 1.73, with 95% confidence. Since the confidence interval does not include 1, it indicates a statistically significant difference between the intervention and control groups.
Step 3: Interpreting the Number Needed to Treat (NNT)
Number Needed to Treat (NNT) tells us how many patients need to be treated for one additional patient to achieve a desired outcome, compared to the control group.
In the study, the NNT for achieving recommended physical activity levels was 12 (95% CI: 7–33).
This means that for every 12 patients who receive the intervention, one additional person will meet the recommended physical activity levels compared to those who receive no intervention or minimal intervention.
An NNT of 12 is considered favorable, as it shows the intervention has a meaningful impact on a population level.
Interpreting Confidence Intervals for NNT: The 95% confidence interval (7 to 33) suggests that the true NNT likely lies between 7 and 33, with 95% confidence. This indicates that the number of patients needed to treat to achieve one additional positive outcome could be as low as 7 or as high as 33.
Step 4: Communicating to Patients
When discussing treatment options with patients, it is important to explain the effectiveness of the intervention using simple, clear terms based on the study’s findings:
“For patients like you who are looking to become more physically active, a study showed that this intervention can increase your chances of meeting recommended physical activity levels by about 42% compared to doing nothing. For every 12 people treated with this approach, one person will achieve the recommended level of activity, making it an effective option for many patients. We’ll also monitor your progress and make adjustments as needed to ensure the plan is effective for you.”
In summary, when prescribing an intervention for physical activity promotion based on Orrow et al. (2012), the Odds Ratio (OR) of 1.42 and the NNT of 12 provide a comprehensive understanding of both the magnitude and practical impact of the treatment’s effectiveness. The intervention leads to a 42% increase in the likelihood of meeting physical activity recommendations and requires treating 12 patients for one additional patient to achieve this outcome. This makes the intervention both statistically and clinically significant for promoting physical activity among sedentary adults in primary care.
6. Step-by-Step Guide To Prescribe An Intervention Using Relative Risk Reduction (RRR) and Number Needed to Treat (NNT) From a Critical Review
In this section, I will explain how to prescribe an intervention using the concepts of Relative Risk Reduction (RRR) and Number Needed to Treat (NNT), using the study by Sugimoto et al. (2011) as an example.
Step 1: Understanding the Context
The review by Sugimoto et al. (2011) evaluated the effect of neuromuscular training on reducing the risk of anterior cruciate ligament (ACL) injuries, specifically in female athletes. It calculated both RRR and NNT to assess how effective neuromuscular training was in preventing ACL injuries during a competitive season.
Intervention Group: Female athletes receiving neuromuscular training.
Control Group: Female athletes not receiving the intervention.
Step 2: Interpreting Relative Risk Reduction (RRR)
Relative Risk Reduction (RRR) is a measure of how much the risk of an outcome (e.g., ACL injury) is reduced in the intervention group compared to the control group. It tells us the proportional reduction in risk due to the intervention.
For non-contact ACL injuries, the RRR was 73.4% (95% CI = 62.5% to 81.1%). This means that the neuromuscular training intervention reduced the risk of non-contact ACL injuries by 73.4% compared to the control group.
For overall ACL injuries, the RRR was 43.8% (95% CI = 28.9% to 55.5%). The intervention reduced the risk of all ACL injuries (including contact injuries) by 43.8%.
Interpreting Confidence Intervals (CI): In both cases, the 95% confidence intervals provide a range of likely RRR values. For non-contact ACL injuries, the CI (62.5% to 81.1%) shows a relatively narrow range, suggesting high confidence in the estimate. For overall ACL injuries, the CI (28.9% to 55.5%) indicates a broader range and therefore more uncertainty in the estimate. However, both intervals exclude 0%, confirming that the intervention is effective at reducing ACL injury risk.
Step 3: Interpreting Number Needed to Treat (NNT)
Number Needed to Treat (NNT) is the number of patients that need to be treated to prevent one additional negative outcome (e.g., an ACL injury). Lower NNT values indicate a more effective intervention.
For non-contact ACL injuries, the NNT was 108 (95% CI = 86 to 150). This means that 108 athletes need to undergo neuromuscular training to prevent one non-contact ACL injury over the course of a competitive season.
For overall ACL injuries, the NNT was 120 (95% CI = 74 to 316), indicating that 120 athletes need to be trained to prevent one overall ACL injury.
Interpreting Confidence Intervals for NNT: The confidence intervals for NNT provide insight into the range of uncertainty. For non-contact ACL injuries, the NNT CI (86 to 150) shows a moderate range, suggesting a reasonable level of confidence in the estimate. However, for overall ACL injuries, the NNT CI (74 to 316) shows a wider range, indicating more uncertainty and suggesting that more studies or data may be needed to refine this estimate.
Step 4: Communicating to Patients
When explaining the impact of neuromuscular training to reduce ACL injuries, you might say:
“For every 108 female athletes who undergo neuromuscular training, one non-contact ACL injury can be prevented during a competitive season. While this may seem like a large number, the training reduces the risk of these injuries by 73%, which is a significant reduction. For overall ACL injuries, the training reduces the risk by 44%, but it would take training 120 athletes to prevent one injury. Despite needing to treat a large number of athletes, the risk reduction is substantial, especially for non-contact injuries.”
The study by Sugimoto et al. (2012) shows that neuromuscular training leads to substantial reductions in ACL injury risk, especially for non-contact injuries, though the relatively high NNT values suggest the intervention may be more efficient if combined with other strategies, such as screening for high-risk athletes.
Using RRR, NNT, and CI provides a clear and comprehensive way to communicate the benefits of neuromuscular training for preventing ACL injuries in female athletes. As NNT is influenced by patient baseline risk, outcome, and clinical setting, making it variable across locations and time, it is best to use NNT derived using RRR applied to specific population risks rather than pooled absolute differences such as RD in clinical practice (Ebrahim, S. and Smith, G. 1999). RRR is less influenced by the absolute baseline risk of the population than RD. This makes RRR more consistent and comparable across different studies and populations, allowing for better generalization of results.
Reference:
1. Tichelaar, J., Richir, M. C., Garner, S., Hogerzeil, H., & de Vries, T. P. (2020). WHO guide to good prescribing is 25 years old: quo vadis?. European journal of clinical pharmacology, 76, 507-513.
2. Thompson WR, Sallis R, Joy E, Jaworski CA, Stuhr RM, Trilk JL. Exercise Is Medicine. Am J Lifestyle Med. 2020 Apr 22;14(5):511-523. doi: 10.1177/1559827620912192. PMID: 32922236; PMCID: PMC7444006.
3. Liguori, G., & American College of Sports Medicine. (2020). ACSM’s guidelines for exercise testing and prescription. Lippincott Williams & Wilkins.
4. Clar C, Tsertsvadze A, Court R, Hundt GL, Clarke A, Sutcliffe P. Clinical effectiveness of manual therapy for the management of musculoskeletal and non-musculoskeletal conditions: systematic review and update of UK evidence report. Chiropr Man Therap. 2014 Mar 28;22(1):12. doi: 10.1186/2045-709X-22-12. PMID: 24679336; PMCID: PMC3997823.
5. Lucie Brosseau, George A Wells, Peter Tugwell, Mary Egan, Keith G Wilson, Claire-Jehanne Dubouloz, Lynn Casimiro, Vivian A Robinson, Jessie McGowan, Angela Busch, Stéphane Poitras, Harvey Moldofsky, Manfred Harth, Hillel M Finestone, Warren Nielson, Angela Haines-Wangda, Marion Russell-Doreleyers, Kim Lambert, Alison D Marshall, Line Veilleux, Ottawa Panel Evidence-Based Clinical Practice Guidelines for Aerobic Fitness Exercises in the Management of Fibromyalgia: Part 1, Physical Therapy, Volume 88, Issue 7, 1 July 2008, Pages 857–871.
6. Lucie Brosseau, George A Wells, Peter Tugwell, Mary Egan, Keith G Wilson, Claire-Jehanne Dubouloz, Lynn Casimiro, Vivian A Robinson, Jessie McGowan, Angela Busch, Stéphane Poitras, Harvey Moldofsky, Manfred Harth, Hillel M Finestone, Warren Nielson, Angela Haines-Wangda, Marion Russell-Doreleyers, Kim Lambert, Alison D Marshall, Line Veilleux, Ottawa Panel Evidence-Based Clinical Practice Guidelines for Strengthening Exercises in the Management of Fibromyalgia: Part 2, Physical Therapy, Volume 88, Issue 7, 1 July 2008, Pages 873–886
7. Poulsen E, Hartvigsen J, Christensen HW, Roos EM, Vach W, Overgaard S. Patient education with or without manual therapy compared to a control group in patients with osteoarthritis of the hip. A proof-of-principle three-arm parallel group randomized clinical trial. Osteoarthritis Cartilage. 2013 Oct;21(10):1494-503. doi: 10.1016/j.joca.2013.06.009. Epub 2013 Jun 21. PMID: 23792189.
8. Pourahmadi M, Dommerholt J, Fernández-de-Las-Peñas C, Koes BW, Mohseni-Bandpei MA, Mansournia MA, Delavari S, Keshtkar A, Bahramian M. Dry Needling for the Treatment of Tension-Type, Cervicogenic, or Migraine Headaches: A Systematic Review and Meta-Analysis. Phys Ther. 2021 May 4;101(5):pzab068. doi: 10.1093/ptj/pzab068. PMID: 33609358.
9. Orrow G, Kinmonth AL, Sanderson S, Sutton S. Effectiveness of physical activity promotion based in primary care: systematic review and meta-analysis of randomised controlled trials. BMJ. 2012 Mar 26;344:e1389. doi: 10.1136/bmj.e1389. PMID: 22451477; PMCID: PMC3312793
10. Sugimoto, D., Myer, G. D., McKeon, J. M., & Hewett, T. E. (2012). Evaluation of the effectiveness of neuromuscular training to reduce anterior cruciate ligament injury in female athletes: a critical review of relative risk reduction and numbers-needed-to-treat analyses. British journal of sports medicine, 46(14), 979-988.
11. Ebrahim, S., Smith, G. The ‘number need to treat’: does it help clinical decision making?. J Hum Hypertens 13, 721–724 (1999). https://doi.org/10.1038/sj.jhh.1000919.
12. Mendes, D., Alves, C. & Batel-Marques, F. Number needed to treat (NNT) in clinical literature: an appraisal. BMC Med 15, 112 (2017). https://doi.org/10.1186/s12916-017-0875-8
13. Cochrane Handbook, Risk Difference and Number Needed to Treat. Accessed at: https://training.cochrane.org/handbook/archive/v6/chapter-15
14. Keefe RS, Kraemer HC, Epstein RS, Frank E, Haynes G, Laughren TP, McNulty J, Reed SD, Sanchez J, Leon AC. Defining a clinically meaningful effect for the design and interpretation of randomized controlled trials. Innov Clin Neurosci. 2013 May;10(5-6 Suppl A):4S-19S. PMID: 23882433; PMCID: PMC3719483.
15. Li G, Lip GYH, Marcucci M, Thabane L, Tian J, Levine MAH. The number needed to treat for net effect (NNTnet) as a metric for measuring combined benefits and harms. J Clin Epidemiol. 2020 Sep;125:100-107. doi: 10.1016/j.jclinepi.2020.05.031. Epub 2020 Jun 6. PMID: 32512185.
16. Oxford CEBM, NNT Calculator. Accessed at: https://www.cebm.ox.ac.uk/resources/ebm-tools/number-needed-to-treat-nnt
17. Cochrane Handbook, Interpreting Effect Sizes. Accessed at: https://training.cochrane.org/handbook/current/chapter-06