Probability Tree

The Probability Tree is used by clinicians to solve complex diagnostic challenges. Such diagnostic dilemmas are typically complicated by the lack of clarity/focus during clinical investigation. The application of the strategy called ‘Decision Analysis’, described by Pauker and Kassirer (1) will help estimate the probability of all possible outcomes in a diagnostic challenge and select an optimal course of action. Let us consider data from the study … Continue reading Probability Tree
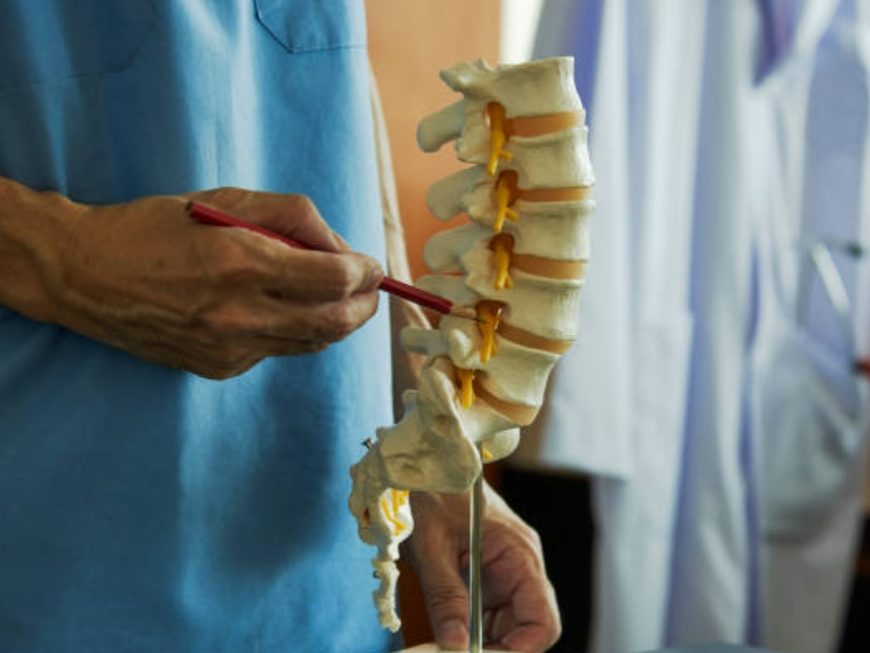
Journey into the lumbar spine | A primer on neuroanatomy

The nerve roots supplying the lumbosacral region originate from the lumbosacral part of the spinal cord and terminate in the conus medullaris, the cone-shaped lower end of the spinal cord. The tip of conus medullaris is often located at approximately the L1–2 intervertebral level, but it may end as high as T12–L1 or as low as L2–3. Therefore, the lower lumbar and sacral nerve roots … Continue reading Journey into the lumbar spine | A primer on neuroanatomy

Diagnostic Efficiency

The receiver operating characteristic (ROC) curve is a measure of diagnostic efficiency, which is obtained by graphically plotting a series of true positive rates (sensitivity) against false positive rates (1 – specificity) for a binary outcome system. The ROC curve is a method to visualize the performance of a test with binary outcomes (+ / -) graphically. The area under the ROC (AUROC) curve is equal to the … Continue reading Diagnostic Efficiency